The softmax function is also called the normalized exponential function.
It is a generalization of the logistic function that "squashes" a K-dimensional vector of arbitrary real values to a K-dimensional vector of real values in the range [0, 1] that add up to 1.
In probability theory, the output of the softmax function can be used to represent a categorical distribution – that is, a probability distribution over K different possible outcomes.
Example:
We know that every image in MNIST is of a handwritten digit between zero and nine. So there are only ten possible things that a given image can be. We want to be able to look at an image and give the probabilities for it being each digit. For example, our model might look at a picture of a nine and be 85% sure it's a nine, but give a 5% chance to it being an eight (because of the top loop) and a bit of probability to all the others because it isn't 100% sure.
![[y1, y2, y3] = softmax(W11*x1 + W12*x2 + W13*x3 + b1, W21*x1 + W22*x2 + W23*x3 + b2, W31*x1 + W32*x2 + W33*x3 + b3)](https://www.tensorflow.org/images/softmax-regression-scalarequation.png)
![[y1, y2, y3] = softmax([[W11, W12, W13], [W21, W22, W23], [W31, W32, W33]]*[x1, x2, x3] + [b1, b2, b3])](https://www.tensorflow.org/images/softmax-regression-vectorequation.png)
It is a generalization of the logistic function that "squashes" a K-dimensional vector of arbitrary real values to a K-dimensional vector of real values in the range [0, 1] that add up to 1.


In probability theory, the output of the softmax function can be used to represent a categorical distribution – that is, a probability distribution over K different possible outcomes.
Example:
We know that every image in MNIST is of a handwritten digit between zero and nine. So there are only ten possible things that a given image can be. We want to be able to look at an image and give the probabilities for it being each digit. For example, our model might look at a picture of a nine and be 85% sure it's a nine, but give a 5% chance to it being an eight (because of the top loop) and a bit of probability to all the others because it isn't 100% sure.
This is a classic case where a softmax regression is a natural, simple model. If you want to assign probabilities to an object being one of several different things, softmax is the thing to do, because softmax gives us a list of values between 0 and 1 that add up to 1. Even to train more sophisticated models, the final step is usually a layer of softmax.
A softmax regression has two steps: first we add up the evidence of our input being in certain classes, and then we convert that evidence into probabilities.
To tally up the evidence that a given image is in a particular class, we do a weighted sum of the pixel intensities. The weight is negative if that pixel having a high intensity is evidence against the image being in that class, and positive if it is evidence in favor.
We also add some extra evidence called a bias. Basically, we want to be able to say that some things are more likely independent of the input. The result is that the evidence for a class given an input is:
where is the weights and is the bias for class , and is an index for summing over the pixels in our input image . We then convert the evidence tallies into our predicted probabilities using the "softmax" function:
Here softmax is serving as an "activation" or "link" function, shaping the output of our linear function into the form we want -- in this case, a probability distribution over 10 cases. You can think of it as converting tallies of evidence into probabilities of our input being in each class. It's defined as:
If you expand that equation out, you get:
But it's often more helpful to think of softmax the first way: exponentiating its inputs and then normalizing them. The exponentiation means that one more unit of evidence increases the weight given to any hypothesis multiplicatively. And conversely, having one less unit of evidence means that a hypothesis gets a fraction of its earlier weight. No hypothesis ever has zero or negative weight. Softmax then normalizes these weights, so that they add up to one, forming a valid probability distribution. (To get more intuition about the softmax function, check out the section on it in Michael Nielsen's book, complete with an interactive visualization.)
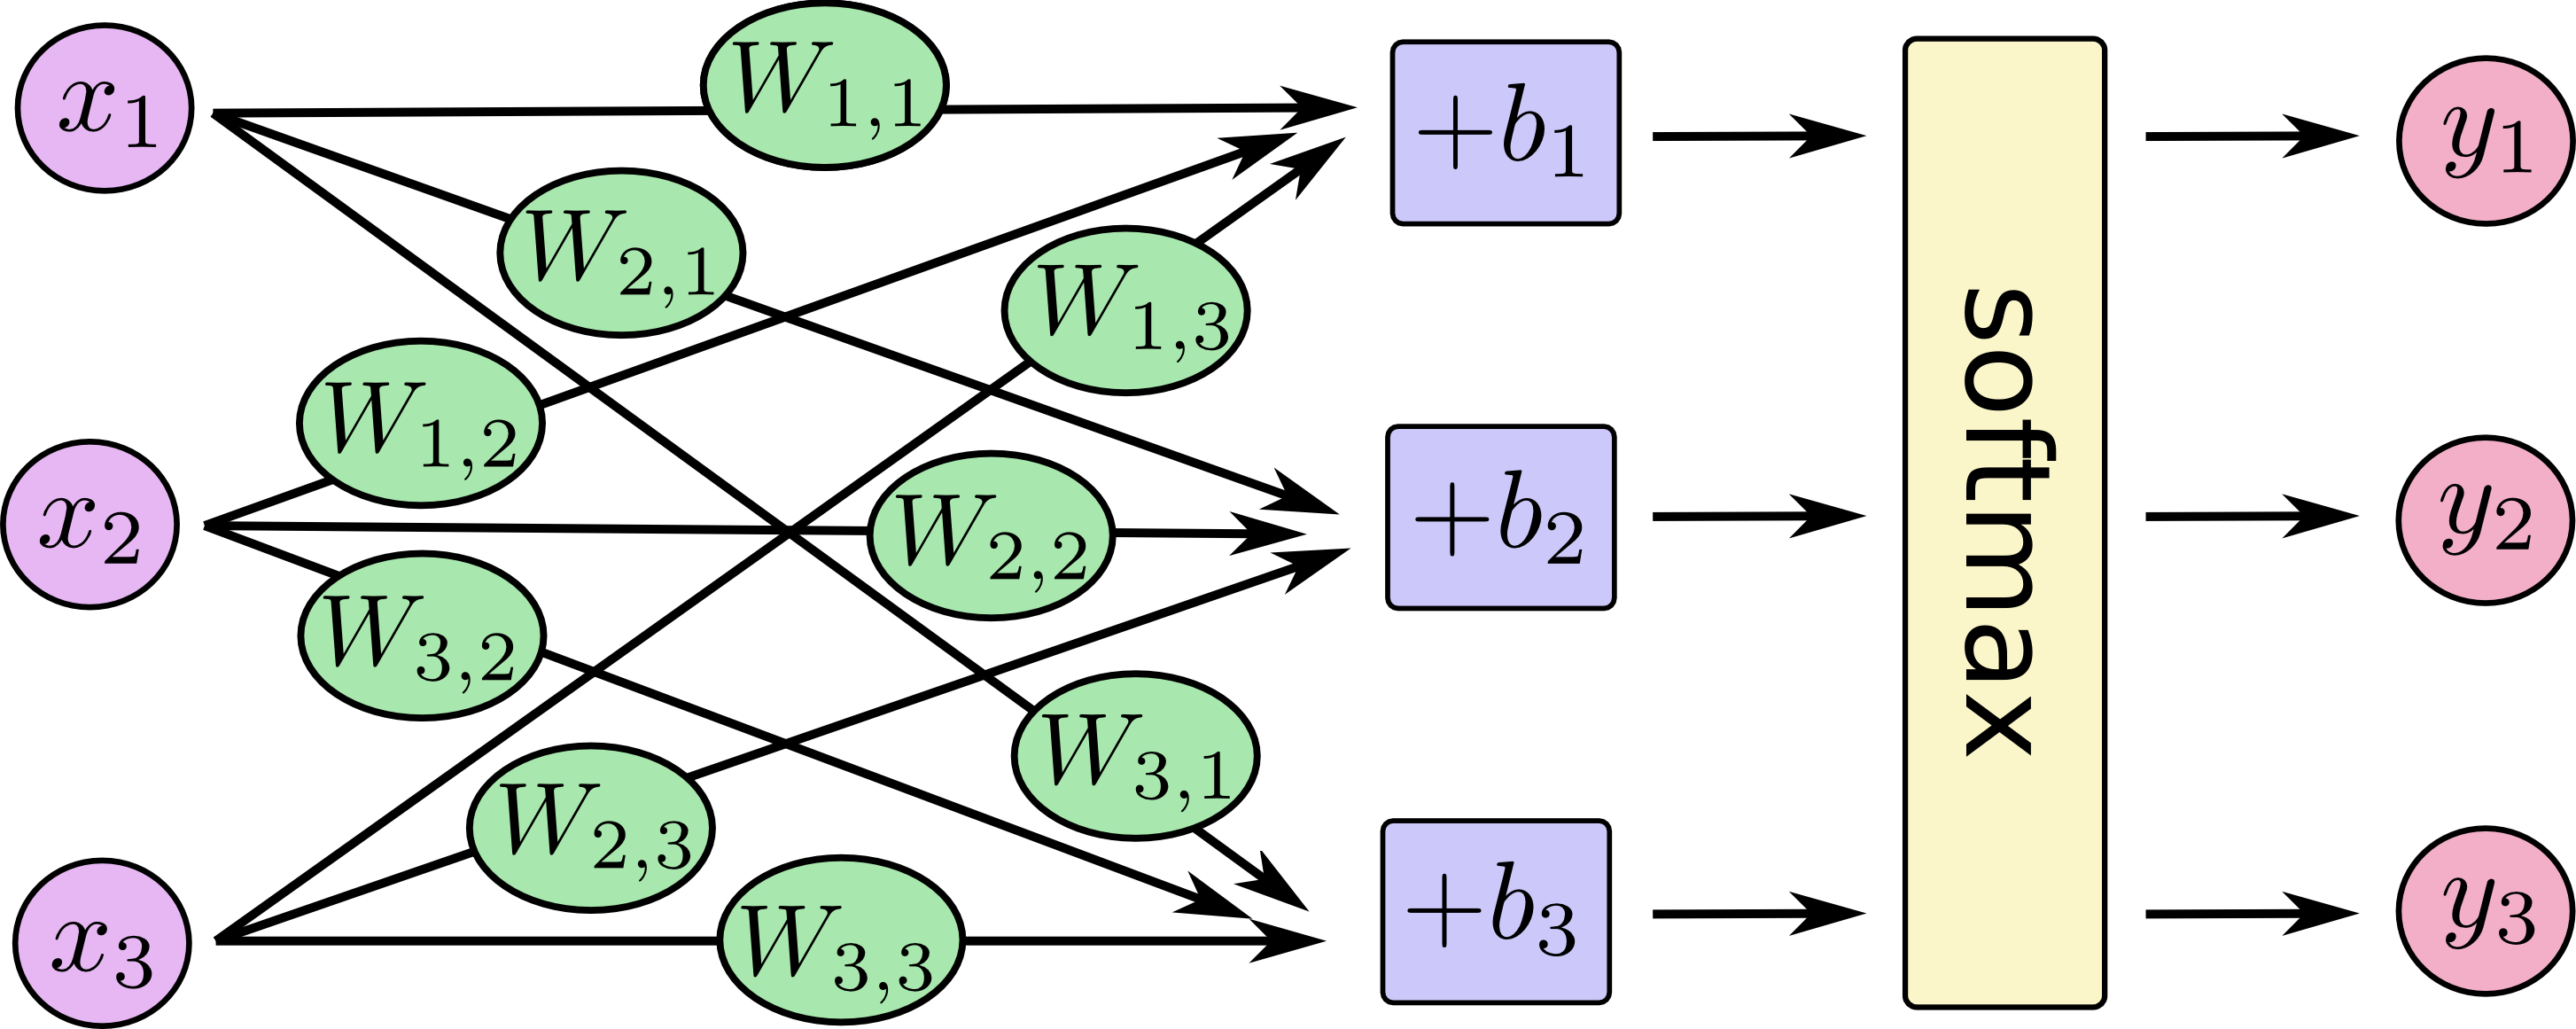
You can picture our softmax regression as looking something like the following, although with a lot more s. For each output, we compute a weighted sum of the s, add a bias, and then apply softmax.
If we write that out as equations, we get:
We can "vectorize" this procedure, turning it into a matrix multiplication and vector addition. This is helpful for computational efficiency. (It's also a useful way to think.)
More compactly, we can just write:
The idea of softmax is to define a new type of output layer for our neural networks. It begins in the same way as with a sigmoid layer, by forming the weighted inputs*
However, we don't apply the sigmoid function to get the output. Instead, in a softmax layer we apply the so-called softmax function to the . According to this function, the activation of the th output neuron is
where in the denominator we sum over all the output neurons.
As a result, if increases, then the other output activations must decrease by the same total amount, to ensure the sum over all activations remains . And, of course, similar statements hold for all the other activations.
However, we don't apply the sigmoid function to get the output. Instead, in a softmax layer we apply the so-called softmax function to the . According to this function, the activation of the th output neuron is
In fact, if you look closely, you'll see that in both cases the total change in the other activations exactly compensates for the change in . The reason is that the output activations are guaranteed to always sum up to , as we can prove using Equation (78) and a little algebra:
Equation (78) also implies that the output activations are all positive, since the exponential function is positive. Combining this with the observation in the last paragraph, we see that the output from the softmax layer is a set of positive numbers which sum up to . In other words, the output from the softmax layer can be thought of as a probability distribution.
The fact that a softmax layer outputs a probability distribution is rather pleasing. In many problems it's convenient to be able to interpret the output activation as the network's estimate of the probability that the correct output is . So, for instance, in the MNIST classification problem, we can interpret as the network's estimated probability that the correct digit classification is .
The fact that a softmax layer outputs a probability distribution is rather pleasing. In many problems it's convenient to be able to interpret the output activation as the network's estimate of the probability that the correct output is . So, for instance, in the MNIST classification problem, we can interpret as the network's estimated probability that the correct digit classification is .
Comments
Post a Comment